In Photoshop CS4/5, do you know exactly what are actually viewed when soft proofing is checked or unchecked and with soft Proof set to Windows sRGB or Monitor.
sRGB ProPhoto
Data Info (Lab=38,13,14) (Lab=38,14,14)
(CS5) 115,82,68 82,68,55
Following RGB values
were read with color picker
Soft Proof OFF * 119,90,75 121,90,75 CM
Soft Proof: sRGB * 119,90,75 89,77,63 MCM
Soft Proof: Monitor **115,82,67 82,68,54 NCM
PatchTool Display profile
set to Monitor profile
a) RelCol (BPC) * 121,90,74 121,90,74 Illu=D65
b) Absolute * 119,88,72 119,88,72 Illu=D65
c) RelCol (BPC) * 121,90,74 121,90,74 Illu=D50
d) Absolute * 126,87,60 126,87,60 Illu=D50
* These RGB values were directly read from screen with an color picker and they are monitor profile dependent.
** NCM not affected by monitor profile.
CM : Embedded icc profile tag is honored, monitor profile is applied.
MCM: Monitor profile is applied, however, embedded icc profile tag is ignored.
NCM: No Color Management. The pixel RGB values were sent to monitor.
ColorPic is a free color picker and it can be downloaded from here.
ColorManaging
Thursday, June 30, 2011
Tuesday, January 11, 2011
Saturday, January 1, 2011
Evaluating Printer Profile Gray Tone Reproduction Capability
Friday, December 31, 2010
Evaluating Printer Profile Darkness Reproduction Capability
1881 Test Patches
These test patches are generated with PatchTool and only those patches within the range 7< L< 16 were chosen.
All 1881 patches are within the sRGB color spaces, but not all are within the printer gamut, as shown below.
Test Method
Result
These test patches are generated with PatchTool and only those patches within the range 7< L< 16 were chosen.
 |
| Above show the test patches w.r.t the respective color spaces |
Test Method
Result
 |
| Left: with MP Center: BasICCOLOR Right: PM5 |
Thursday, December 30, 2010
basICCOLOR DropRGB Profiler
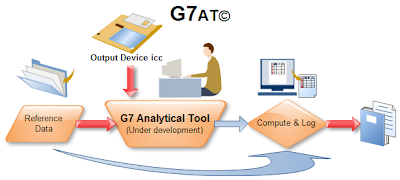
An amazing Profiler, version 1.2 was released in 2006. Just drag&drop the measurement file and the icc profile can be generated. Following test was done with G7at which performs soft proofing of profile accuracy analytically.


 |
| Monaco_s9045-729_basicc.icm generated with dropRGB Profiler |
 |
| Generated with Monaco Profiler, with the same measured data |
RGB 8-bit vs 16-bit
How does bit depth affect the reproduction of the output image?
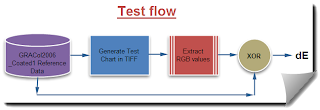
Below comparisons were performed with GRACoL2006_Coated1. 8-bit (per channel) and 16-bit (per channel) tiff files were output with PatchTool. RGB values were then extracted from the tiff files, read back and compared with the reference data.

Summary
Some color patches in GRACoL2006_Coated1 are out of sRGB color space, they are clipped and hence resulting in high dE error.
8-Bit Depth per Channel
Average 90th % 95th %
sRGB 1.27 0.72 9.47
Adobe RGB 0.35 0.52 0.59
ProPhoto RGB 0.44 0.73 0.88
16-Bit Depth per Channel
Average 90th % 95th %
sRGB 1.04 0.38 9.45
Adobe RGB 0.04 0.01 0.01
ProPhoto RGB 0.00 0.01 0.01
Below comparisons were performed with GRACoL2006_Coated1. 8-bit (per channel) and 16-bit (per channel) tiff files were output with PatchTool. RGB values were then extracted from the tiff files, read back and compared with the reference data.

 |
| sRGB |
 |
| Adobe RGB |
 |
| ProPhoto |
Some color patches in GRACoL2006_Coated1 are out of sRGB color space, they are clipped and hence resulting in high dE error.
8-Bit Depth per Channel
Average 90th % 95th %
sRGB 1.27 0.72 9.47
Adobe RGB 0.35 0.52 0.59
ProPhoto RGB 0.44 0.73 0.88
16-Bit Depth per Channel
Average 90th % 95th %
sRGB 1.04 0.38 9.45
Adobe RGB 0.04 0.01 0.01
ProPhoto RGB 0.00 0.01 0.01
Tuesday, December 28, 2010
Retrieving a Monaco Session with CP2
Restore a Monaco session into CGATS format
Monaco session saves the colorimetric data in Lab values only, no spectral data was saved. Following procedure helps to recover the previously measured Lab values to CGATS file.
1. Open ColorPort2, go to Measure Target menu and select the appropriate target to be restored. Drag&drop the saved Monaco session data into CP2.
2. Save data in CGATS.
Do not save with PM5 option. The reason being that PM5 option saves both rgb and spectral data. The RGB data cannot be used for printer profiling.
CGATS option in CP2 saves data in RGB, Lab as well as spectral reflectance. Remember to select spectral value scale 0-100 as that is the default for PM5.
The spectral fields for both output options are null.
3. Open the saved file with a notepad editor. Delete the spectral field header, row count is optional, others untouched. Refer to the illustration for clarity.

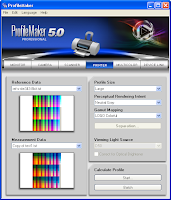
4. Open PM5 ProfileMaker, assign the corresponding reference data and drag&drop the edited file. You are now ready to proceed to generate the icc profile.
Monaco session saves the colorimetric data in Lab values only, no spectral data was saved. Following procedure helps to recover the previously measured Lab values to CGATS file.
1. Open ColorPort2, go to Measure Target menu and select the appropriate target to be restored. Drag&drop the saved Monaco session data into CP2.
2. Save data in CGATS.
Do not save with PM5 option. The reason being that PM5 option saves both rgb and spectral data. The RGB data cannot be used for printer profiling.
CGATS option in CP2 saves data in RGB, Lab as well as spectral reflectance. Remember to select spectral value scale 0-100 as that is the default for PM5.
The spectral fields for both output options are null.
3. Open the saved file with a notepad editor. Delete the spectral field header, row count is optional, others untouched. Refer to the illustration for clarity.

4. Open PM5 ProfileMaker, assign the corresponding reference data and drag&drop the edited file. You are now ready to proceed to generate the icc profile.
Monday, December 27, 2010
Yet Another Way for Evaluating Profile Performance
The idea is to capture the image instead of printing it out and carrying out the physical measurement. With this 'soft' approach, neither ink nor paper is needed, and any profile can be evaluated without the presence of physical device. The RGB values for the patches will be extracted from the captured image and compared with the reference data.
dE1= 0.42 (error introduced by extraction of RGB values)
dE3= 4.34 for MP
dE1= 0.42 (error introduced by extraction of RGB values)
dE2= 0 (possible error due to raster capture utility)
dE3= 5.07 for PM5dE3= 4.34 for MP
Sunday, December 26, 2010
Evalute Profile Soft Proofing Capability
AtoB1 in the icc profile specifies, with colorimetric rendering intent, the required conversion for device data (RGB or CMKY) to PCS data (Lab, typically). The information related to the transformation is derived solely from the characteristic data gathered during the profiling process and the implementation is pretty unknown to the end user. The accuracy of the employed technique will greatly determine the profile soft proofing capability.
Methodology
The same set of measured data for creating of the printer icc profiles with PM5 and MP, was used. The 120-patch test charts were generated for each profile, measurements were compared with the reference data.
1) Gamutvision
By setting both the input (Profile 1 or 3) and output (profile 2 & 4) to the same printer profile, the accuracy of the conversion can be thus tested.
a) Firstly, the test image was read according to the input file (the printer profile under test). In effect, the PCS output at this stage is the PCS data for the printer.
b) The input image is then mapped to to the output image according to the selected rendering intent. As the input profile is the same as output profile, no actual conversion should be taken place. Setting to either relative or absolute intents does not make any difference as the same conversion LUT table is used, BtoA1, I supposed.
In actual fact, above test is very similar to the round-trip test. (identical test?)
2) ColorThink Pro 3: Evaluate Profile Proofing
3) Hard Proofing
The best way to test a profile is to carry out a test print with the profile. It reflects the overall performance of the profile quality, and no way that we can test only the soft proofing portion of the printer profile.
References:
Evaluate Profile Proofing by ColorThink Pro 3
Using Gamutvision
Methodology
The same set of measured data for creating of the printer icc profiles with PM5 and MP, was used. The 120-patch test charts were generated for each profile, measurements were compared with the reference data.
1) Gamutvision
By setting both the input (Profile 1 or 3) and output (profile 2 & 4) to the same printer profile, the accuracy of the conversion can be thus tested.
a) Firstly, the test image was read according to the input file (the printer profile under test). In effect, the PCS output at this stage is the PCS data for the printer.
b) The input image is then mapped to to the output image according to the selected rendering intent. As the input profile is the same as output profile, no actual conversion should be taken place. Setting to either relative or absolute intents does not make any difference as the same conversion LUT table is used, BtoA1, I supposed.
In actual fact, above test is very similar to the round-trip test. (identical test?)
 |
| with built-in 24 checker image |
 |
| with 120 test patches |
 |
| with 1617 test patches |
2) ColorThink Pro 3: Evaluate Profile Proofing
 |
| with CTP3, 120 test patches |
3) Hard Proofing
The best way to test a profile is to carry out a test print with the profile. It reflects the overall performance of the profile quality, and no way that we can test only the soft proofing portion of the printer profile.
References:
Evaluate Profile Proofing by ColorThink Pro 3
Using Gamutvision
Saturday, December 25, 2010
Gamut Boundary: PM5 vs MP
 |
| Viewed with CTP3 |
Profile Graphing by ColorThink3 Myth 26
In CT3, gamut is plotted with AtoB transformation which is used normally for soft proofing, as oppose to some other graphers that employ "round-trip" transformation. Nevertheless, the calculated gamut volumes or overall gamut displayed do not deviate significantly for either methods used.
Refer to above plot, the center (vertex) of the white point is L=100 (not L=0, viewed from bottom to top). In general , the boundary vectors for MP is smooth and well distributed but that is not so for PM5.
All above illustrations have one thing in common, that they were all derived from the same set of measurement data.
Lab Gamut
 |
| http://www.brucelindbloom.com/index.html?Home.html |
 |
| Photos courtesy and copyright © Bruce Justin Lindbloom |
Bruce BabelColor
Apple RGB 798,403 894,338
sRGB 832,870 934,328
Adobe RGB (1998) 1,208,631 1,346,825
Lab 2,381,085 NA
ProPhoto 2,879,568 2,653,173
Some of the possible Lab values are illustrated as above. The white gamut boundary is the sRGB color space and it is shown for comparison purpose. All Lab values were generated with BabelColor PatchTool.
Selection of Test Patches: PM vs MP
Side by side comparison between the test patches for PM5 and MP is as shown above. The test patches for the profiling target for MP is evenly spread out in the RGB space whereas for PM5, more sample patches are centered along the gray axis (R=G=B). Following illustrates the test patches around the sRGB gamut boundary, they are well distributed for both profilers.
Monoca 343 Target for RGB Printer Profiling
3 built-in test charts are available for Monaco RGB printer profiling. The smallest test chart consists of 343 reference patches. These test charts are preassigned and its RGB reference set does not make known publicly. But one can still extract such information after the measured result is saved in Monaco session file in that the RGB data is stored in 16-bit RGB values. If the RGB reference data is altered by more than 1 count the profiler will reject the saved session data set.
The RGB reference points are equally spaced. For Monaco 343 test chart, each RGB channel was divided into 7 points from value 0 to 255, hence 7x7x7 or 343 test points.
The reference RGB, measured Lab data and the printer gamut which was derived from the measured Lab, are illustrated below.
The RGB reference points are equally spaced. For Monaco 343 test chart, each RGB channel was divided into 7 points from value 0 to 255, hence 7x7x7 or 343 test points.
The reference RGB, measured Lab data and the printer gamut which was derived from the measured Lab, are illustrated below.
Subscribe to:
Posts (Atom)


